

Catchment area calculation using Bhuvan and QGIS software
Bhuvan is a web-based mapping software developed by the Indian Space Research Organisation (ISRO). To calculate the catchment area using Bhuvan and QGIS software, you can follow these steps:
Open the Bhuvan website (bhuvan.nrsc.gov.in) in your web browser.

Zoom to area under consideration, here we are calculating catchment area for Kahandolpada bridge near Peth in Nashik District. You can switch to Satellite view or Hybrid view to get exact location if you don't have coordinates.

Select Base Hydrology Maps

Go to Tools → Select Draw Tools
Select Polygon Option

Zoom out and draw approximate polygon along water streams.

Go to Catchment option from Tools → shift to Satellite view → zoom to exact bridge location → click on location.

Click on Delineation button. Actual catchment area will appear in RED colour.

Click on Download button to download files used in GIS softwares.

Save files in desired folder.
Open QGIS → Project → New

Layers → Add Vector Layer → Select downloaded shp file → Add

The result will look like this:

To make it transparent, right click on catchment layer → Properties → adjust transparency.

Here one can select type as per his wish. I am selecting red border only.

Right click on Catchment layer → Right click mouse → Select Attribute Table.
Attribute table dialog box will open.

Click on Edit (left corner) and write expression $area in Expression bar.
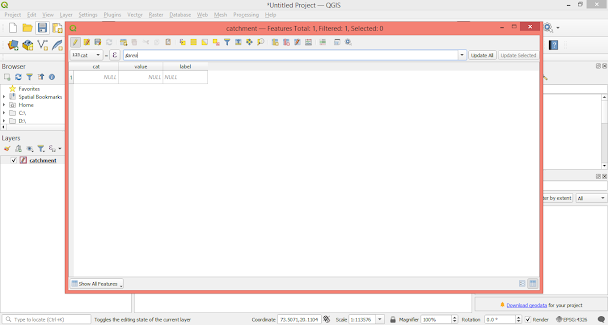
Click on Update All

Area Calculated = 215.160 sq.km
Our Approximate area = 211.630 sq.km
So it can be concluded that Bhuvan in combination with QGIS can be used to calculate catchment area quickly.
Final output after adding World map

It can be exported as Image, PDF & DXF
Exported Image from Bhuvan

According to Global watershed report, outlet near 20.212° S, 73.464° E with drainage area approx 228 km².
Land cover in watershed
| Land Cover | 2000 (km²) | 2020 (km²) | Change |
|---|---|---|---|
| Dense short vegetation | 180 | 172 | -4% |
| Tree cover | 23 | 24 | 4% |
| Cropland | 11 | 15 | 35% |
| Built-up | 1.1 | 3.4 | 213% |
| Open surface water | 0.9 | 2.8 | 199% |


1 Comments
Pl.make vedio of calculating catchment area.
ReplyDeleteIf you have any doubts, suggestions , corrections etc. let me know